If there is one tool that has revolutionised how I develop (or more specifially investigate/re-engineer and analyse) web sites and applications its got to be Firebug: http://www.getfirebug.com/
Its great for those situations when you come across a site and think – how did they do that?! Clicking on the firebug utility (a green tick in the bottom right of firefox – once you’ve enabled it) and getting it to inspect the page soon reveals all!
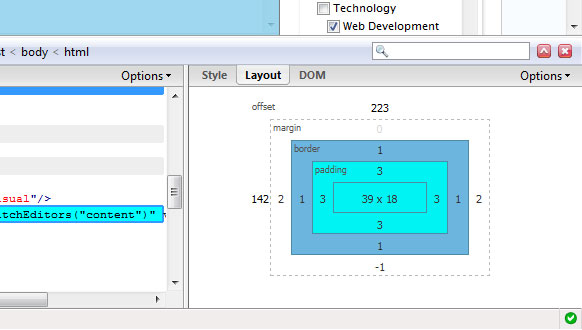
Its also really handy for CSS – borders and spacing are visually displayed:

Recently I found a great little video on debugging AJAX applications with Firebug and the Zend Debugger which looks really useful. The Zend Debugger is another great PHP development tool which works really well if you have the Zend Studio IDE – when I find some more time I may well blog about that too!
Update – I discovered Yslow today – http://developer.yahoo.com/yslow/ – a plugin for Firebug that gives tips on Web site performance – pretty nifty.

2 replies on “Firebug – a Web Development Inspector/Debugger for Firefox”
[…] out firefox was using 1.5GB of RAM (yes just firefox – see screenshot below!) Turns out having Firebug switched on whilst using Google Maps isn’t the best of ide Post a […]
[…] Voila – you can install extensions again (like the brilliant FireBug) […]